What is OLAP?
The sophisticated technology behind modern EPM solutions is still a mystery to many. In this blog post, we’ll look at the definition of OLAP as well as an overview of the technology. We explain what lies behind OLAP, what cubes have to do with it and what makes the technology so powerful for modern planning, budgeting, and forecasting.
What is OLAP?
The basis of any EPM solution is digitally available data and Online Analytical Processing (OLAP) organizes and visualizes data multidimensionally. With the major advancements in technology and the huge amount of data that is generated along with those advancements, nearly every business has digitally available data. Often, that data is still only available in hundreds and hundreds of Excel spreadsheets. More data, more spreadsheets.
Entering the cube
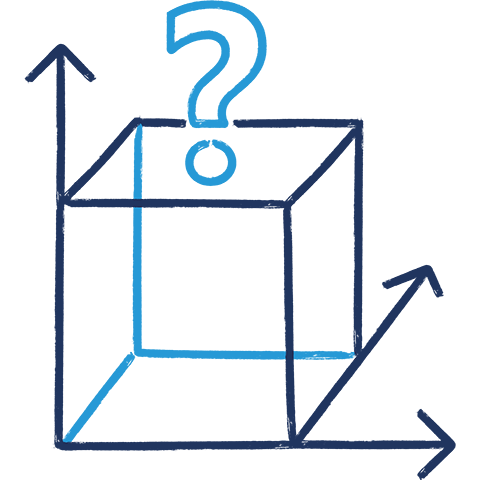
Let us start with the cube. The geometric shape can be represented in a three-axis coordinate system – that is, in three dimensions. Most modern EPM software rely on multidimensional OLAP, also called MOLAP. The name derives from the process that accesses a multidimensional database as its operating foundation.
Let’s say your data set has figures for various products entered, including customers and time of purchase. In cube form, for example, the X-axis in the coordinate system represents the time dimension, the Z-axis represents the customer dimension, and the Y-axis represents your product dimension. The size of the cube is therefore determined by the existing data and is therefore dynamic from the ground up. Each combination of dimension data is assigned values, each of which represents a coordinate in the cube.
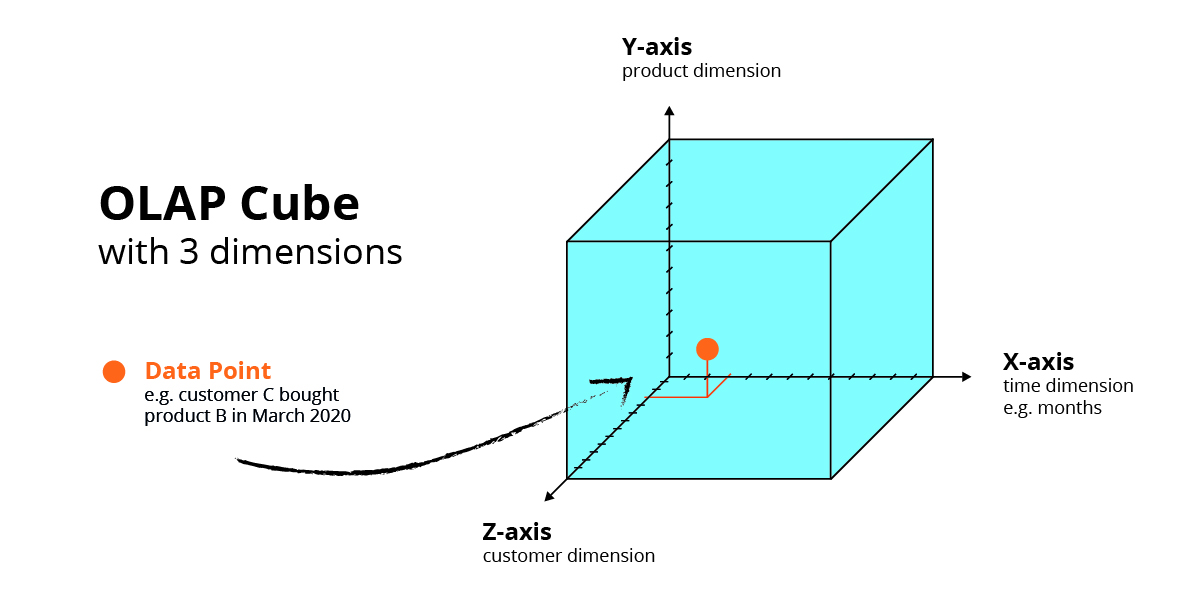
Here’s an example: In March 2020, customer C purchased product B. The result of this relationship are quantifiable values, such as the sales revenue or the amount purchased, which are stored, so to speak, at the coordinate that can now be exactly determined (data point). Using the MOLAP technology, you can use various functions to enter data into an underlying multidimensional database and then process that data.
Thanks to MOLAP, many more dimensions are possible, which quickly exceed average human capabilities for data visualization. To get an idea of how it works, the cube works really well as a model. Additional data dimensions such as region, distribution channel, stock, etc. are often used.
What makes OLAP technology so special?
And we’re back to Excel sheets: Here we have our data on a row and column level, so it’s two-dimensional. This means that the best you can hope for are understanding two-dimensional relationships in your data. Both rows and columns must always be populated, even if this means, for example, that the same month, the same product, or the same customer, etc. is listed several times. As a result, the sheets quickly become large and cumbersome – especially when multiple people have to access them and make changes. This is similar to relational databases, in which a data set (row) is put into relation via attributes (columns) in a two-dimensional way.
With the multidimensional model described above using the cube, multiple entries of the same dimensions become redundant. Once created in the database, they point to the various target coordinates in the form of key figures to which they are linked. The multidimensional arrangement of the data has many advantages. Let’s take a look at the most important ones.

The advantages of OLAP at a glance
The multidimensional approach to data storage allows you to quickly create ad hoc reports, for example by slicing the cube. Following our example above, you might decide to visualize the sales of your entire product range across all customers for a specific year or month. In other words, a complete “slice” of data points with key figures is extracted, whose “thickness” is determined by a specified time period.
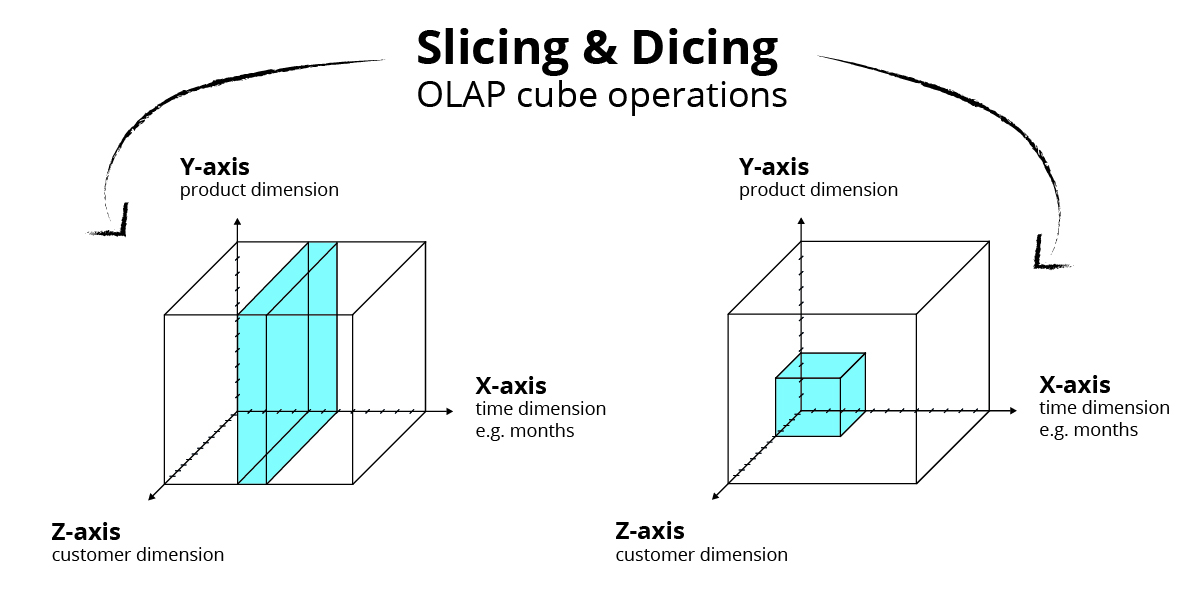
Similarly, “dicing,” i.e. the extraction of a smaller cube from the “main cube,” which contains all the data, is another way to parse your data. For example, you can limit the selection to individual products or product groups in a defined time period and for a select segment of customers.
By creating hierarchies, you can also perform what is commonly known as “drilldowns.” This allows you to obtain detailed values, for example, for individual products in a product group or for the detailed key figures of a single point of sales in your sales network.
In addition to the possibility of fast ad hoc reports, automation for standard reports is one of the key advantages of OLAP. Once correctly set up, the time required and the susceptibility to errors is reduced significantly. Planning processes also benefit because the relevant data can be entered directly into the multidimensional database by planners instead of having to collect and validate the data using endless manual Excel sheets.
Finance professionals and business planners using modern EPM solutions with OLAP technology enjoy a variety of benefits that help to optimize value creation across the organization. Learn more about the powerful technology behind Jedox.
What is OLAP?
OLAP stands for online analytical processing. It organizes business data in multiple dimensions so users can quickly analyze results by factors such as time, product, customer, region, or scenario. This makes it easier to identify trends, compare performance, and answer complex business questions.
What is an OLAP cube?
An OLAP cube is a multidimensional data model that connects measures, such as revenue or costs, with business dimensions. Despite its name, it can contain far more than three dimensions, allowing organizations to analyze data from many different perspectives.
How is OLAP used in EPM?
Within enterprise performance management (EPM), OLAP supports planning, budgeting, forecasting, reporting, and scenario analysis. Finance teams can analyze data from different perspectives, update plans in real time, and work from a single, consistent business model.
How is OLAP different from spreadsheets?
Spreadsheets mainly organize data in rows and columns, while OLAP connects data across many dimensions. This makes complex analysis faster, reduces manual consolidation, and provides a more consistent foundation for planning and reporting.
What are slicing, dicing, and drilling down in OLAP?
Slicing filters data by a single dimension, such as a specific region or time period. Dicing analyzes a smaller subset of data across multiple dimensions, while drilling down moves from summarized results to increasingly detailed information. Together, these capabilities help users explore business data more efficiently.
What are the main benefits of OLAP for Finance teams?
OLAP enables fast ad-hoc analysis, automated reporting, detailed variance analysis, and direct data entry for planning. It reduces manual work, improves data consistency, and helps Finance teams respond more quickly to changing business conditions.
Why is OLAP a strong foundation for AI agents and augmented AI in EPM?
OLAP gives AI agents a structured model of the business, including dimensions, hierarchies, calculations, and business rules. This context helps AI interpret financial data more accurately, identify key drivers, explain results, and generate more reliable forecasts and recommendations.
How does OLAP handle large data volumes and performance?
OLAP systems are designed to query data across multiple dimensions rather than scanning raw transaction records. This structural approach makes complex queries significantly faster than traditional relational databases, even as data volumes grow. Jedox extends this with an in-memory OLAP engine that calculates aggregations dynamically at query time entirely in RAM. This means Finance teams can recalculate forecasts, run what-if scenarios, and refresh reports in seconds, even across large, multi-entity data sets. Write-back is processed in real time within the same model, so plan changes are immediately visible to all users without batch processing or data exports.