Jedox platform release 2022.4 includes heatmaps and simplified dashboards to share insights across the organization
The Jedox platform 2022.4 release introduces a new heatmap visualization that builds upon the popularity of the recent addition of waterfall charts to the planner’s storytelling toolkit. This new chart type empowers integrated business planning (IBP) storytelling by clarifying patterns emerging from underlying data. Management and stakeholder reporting can now feature visualizations from multiple Jedox Web Spreadsheets within a single sharable, responsive Canvas report or dashboard.
Whether viewed in Jedox, exported to PDF, or reviewed within the Jedox Mobile App, business leaders can gain insight from the latest planning and performance data. Other highlights in the 2022.4 release:
- Enhanced security and audit capabilities so organizations can minimize operational risk and maintain elevated compliance and governance standards
- New workflow enhancements and Jedox Integrator usability improvements, further demonstrating the Jedox commitment to delivering value for model developers that drive business results within increasingly complex environments
Altogether, the 2022.4 release provides adaptable and integrated tools for global organizations to more easily communicate the insights that are the foundation of confident decision-making.
Support integrated business planning storytelling and decision-making
Insights that drive a culture of decisiveness are easier to produce and communicate due to the following Jedox platform enhancements:
- Canvas reports that aggregate visualizations and data from any Jedox model. Canvas is the technology Jedox uses to produce stunning, responsive visualizations driven by all the data that matters. With the 2022.4 release, model developers can create simplified Canvas reports that combine charts, source data, and scenario visualizations from any number of existing Jedox models and Jedox Web Spreadsheets. These reports may be shared with management and other stakeholders, so they only analyze relevant information
- Heatmap, a new chart type, helps decision-makers see patterns in data more clearly. In combination with the new Jedox AIssisted™ classification wizard, organizations can understand which revenue streams are outperforming expectations, which customers may be at greatest risk of churning, or even which regions need to shift hiring plans to meet expected demand
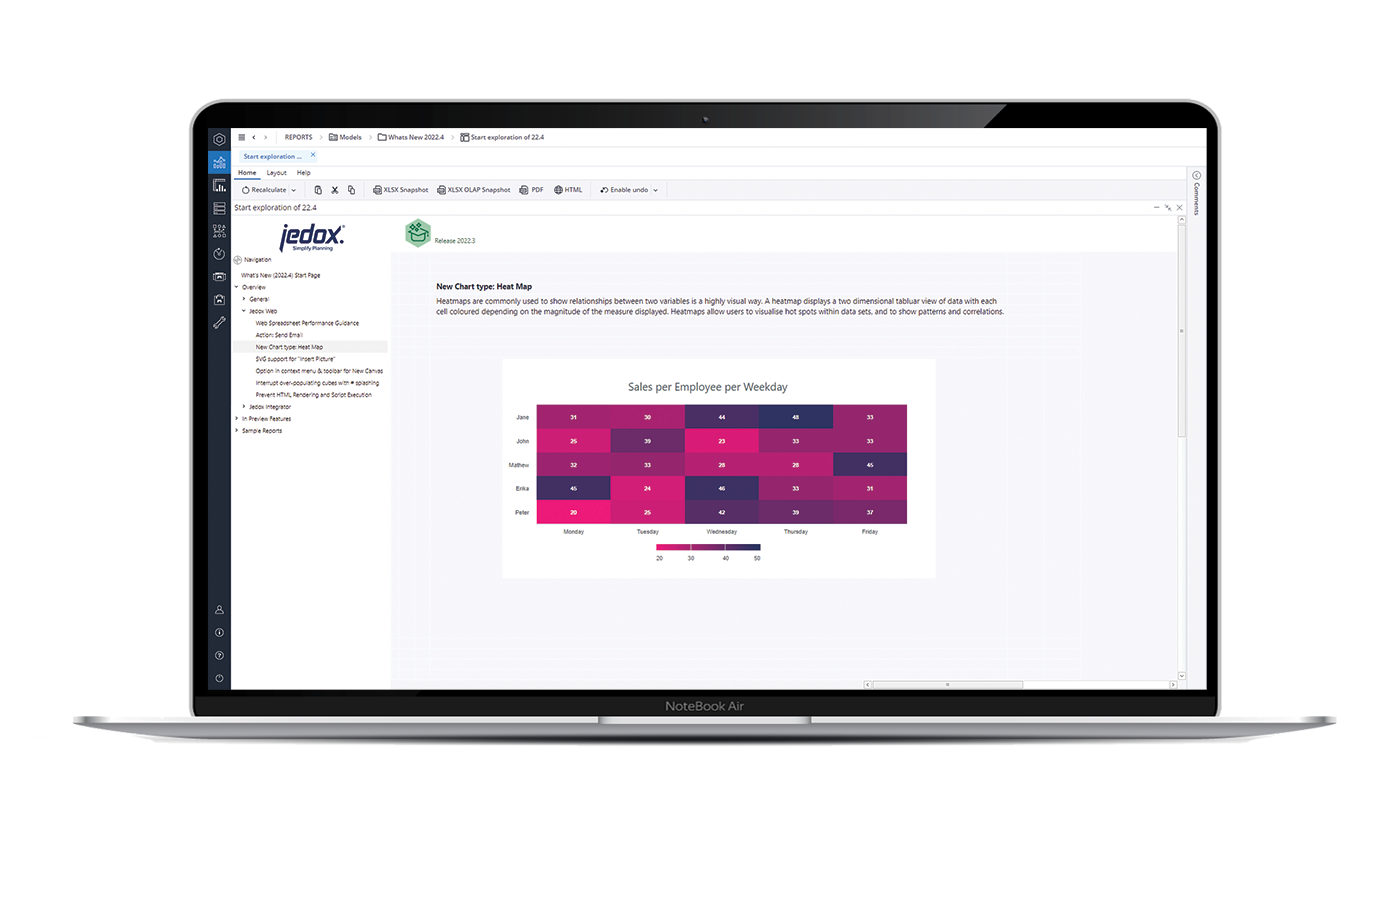
Heatmap example (sales data)
- Streamlined security for connections to business systems and data sources:
- SSO/SAML for Excel connections to adhere to strict Infosec requirements
- SFTP for all file-based connections (Excel, JSON, XML and directory) to future-proof file transfer protocol
- Comprehensive audit functionality to ensure compliance with governance programs:
- Understand who changes attribute values, and when those changes are made throughout all Jedox Cubes and models
- Understand who changes access and security settings, and when those settings are changed
- Additional option of 14-day audit logging view in addition to the default availability of 1, 7, 30, or 365 days
- Benefit from quicker, more straightforward data integrations and workflow development:
- Enhanced workflow actions and abilities for email sends — model developers can build emails that deliver dynamic attachments which include variables defined as a result of workflow collaboration across the organization. Or, planners can generate ad hoc emails to communicate information across the organization.
- Within Jedox Integrator, actions can be executed from a second-level navigation of breadcrumbs to optimize screen space for instructional content
Example of 2022.4 in action: regional sales data combined with best- and worst-case scenarios fuel discussion via the management reporting pack
Imagine, as part of the integrated business planning process, that you need to report weekly changes to resource utilization based on near-real-time demand signals. The weekly management reporting pack needs to combine real-time data in one easy-to-understand dashboard. Your small team, which manages models with drivers coming from across the globe, needs efficient and secure data collection.
The following scenario combines secure data collection, visual dashboards including heatmaps, and workflows:
- Leveraging the workflow you built, an email is sent to all the resource utilization model contributors. It’s time for their weekly contribution. You gather demand signals from employees and partners in the field through secure, interconnected Excel-based data collection forms, and sales data transferred by a partner via SFTP, so Jedox Integrator can load the latest drivers to the model
- All the data that matters drives the charts and visualizations contained within the weekly management reporting pack. In essence, it is an interactive dashboard built in Canvas that combines many data sources and charts from across your Jedox environment
- This dashboard is shared with the executive team and, immediately, the chief operating officer (COO) notices an interesting pattern via a heatmap that shows sales in Asia slowing week over week in certain countries. Luckily, other visualizations show how the real-time data relates to best- and worst-case scenarios, and that there is no reason to panic or make changes based on one short-term view of how the business is performing
- The C-suite discussion quickly moves on as they realize the slowdown in affected countries correlates to a one-time event that should not persist. The notes from their meeting show an action to review the same data in three weeks to see if normal behavior indeed returns.
The 2022.4 release of the Jedox platform continues our commitment to deliver incremental value. If you want to see how Jedox can drive a culture of decisiveness in your organization, and empower you to realize a vision for financial and digital transformation, please request a demo today.