Board-ready reporting: The CFO’s guide to decision-ready financial intelligence
- What is board-ready reporting?
- Why board-ready reporting matters
- Core elements of effective board reporting
- Advantages of board reporting software
- Common challenges and how to fix them
- How AI is transforming board reporting
- How to create a board-ready report: A step-by-step guide
- Best practices for board-ready reporting
- What’s next for your board reporting?
It’s Friday afternoon, and your board meeting is Monday morning. You’re wrestling with spreadsheets, chasing down department heads, and pulling data from various sources. This scenario plays out in Finance departments around the world, but it doesn’t have to. And with growing data complexity and governance needs, a last-minute, manual approach isn’t sustainable.
This guide explores how you can use AI-driven FP&A tools to deliver insightful, board-ready reports that build trust with senior leadership and enable better decision-making.
What is board-ready reporting?
Board-ready reporting is the practice of preparing concise, decision-ready, and audit-proof financial information for a company’s board of directors.
A board-ready report connects financial performance to strategic goals and answers high-level, strategic questions, such as:
- Are we on track?
- What risks do we face?
- Where should we invest next?
Unlike management reporting, which focuses on operational details and departmental performance, board reporting zooms out to the big picture. Board members don’t typically need to see every line item or departmental budget. They just need information that’s actionable, relevant, and clear.
A board-ready report typically includes these essential components:
- Executive summary: A one-page overview that answers the board’s most pressing questions before they ask them
- Strategic KPIs: Metrics tied directly to company objectives, not just departmental or vanity metrics
- Financial forecasts: Forward-looking projections that show where the business is heading
- Risk assessment: Flagging potential obstacles and mitigation strategies
- Supporting schedules: Detailed backup data that supports the summary-level insights
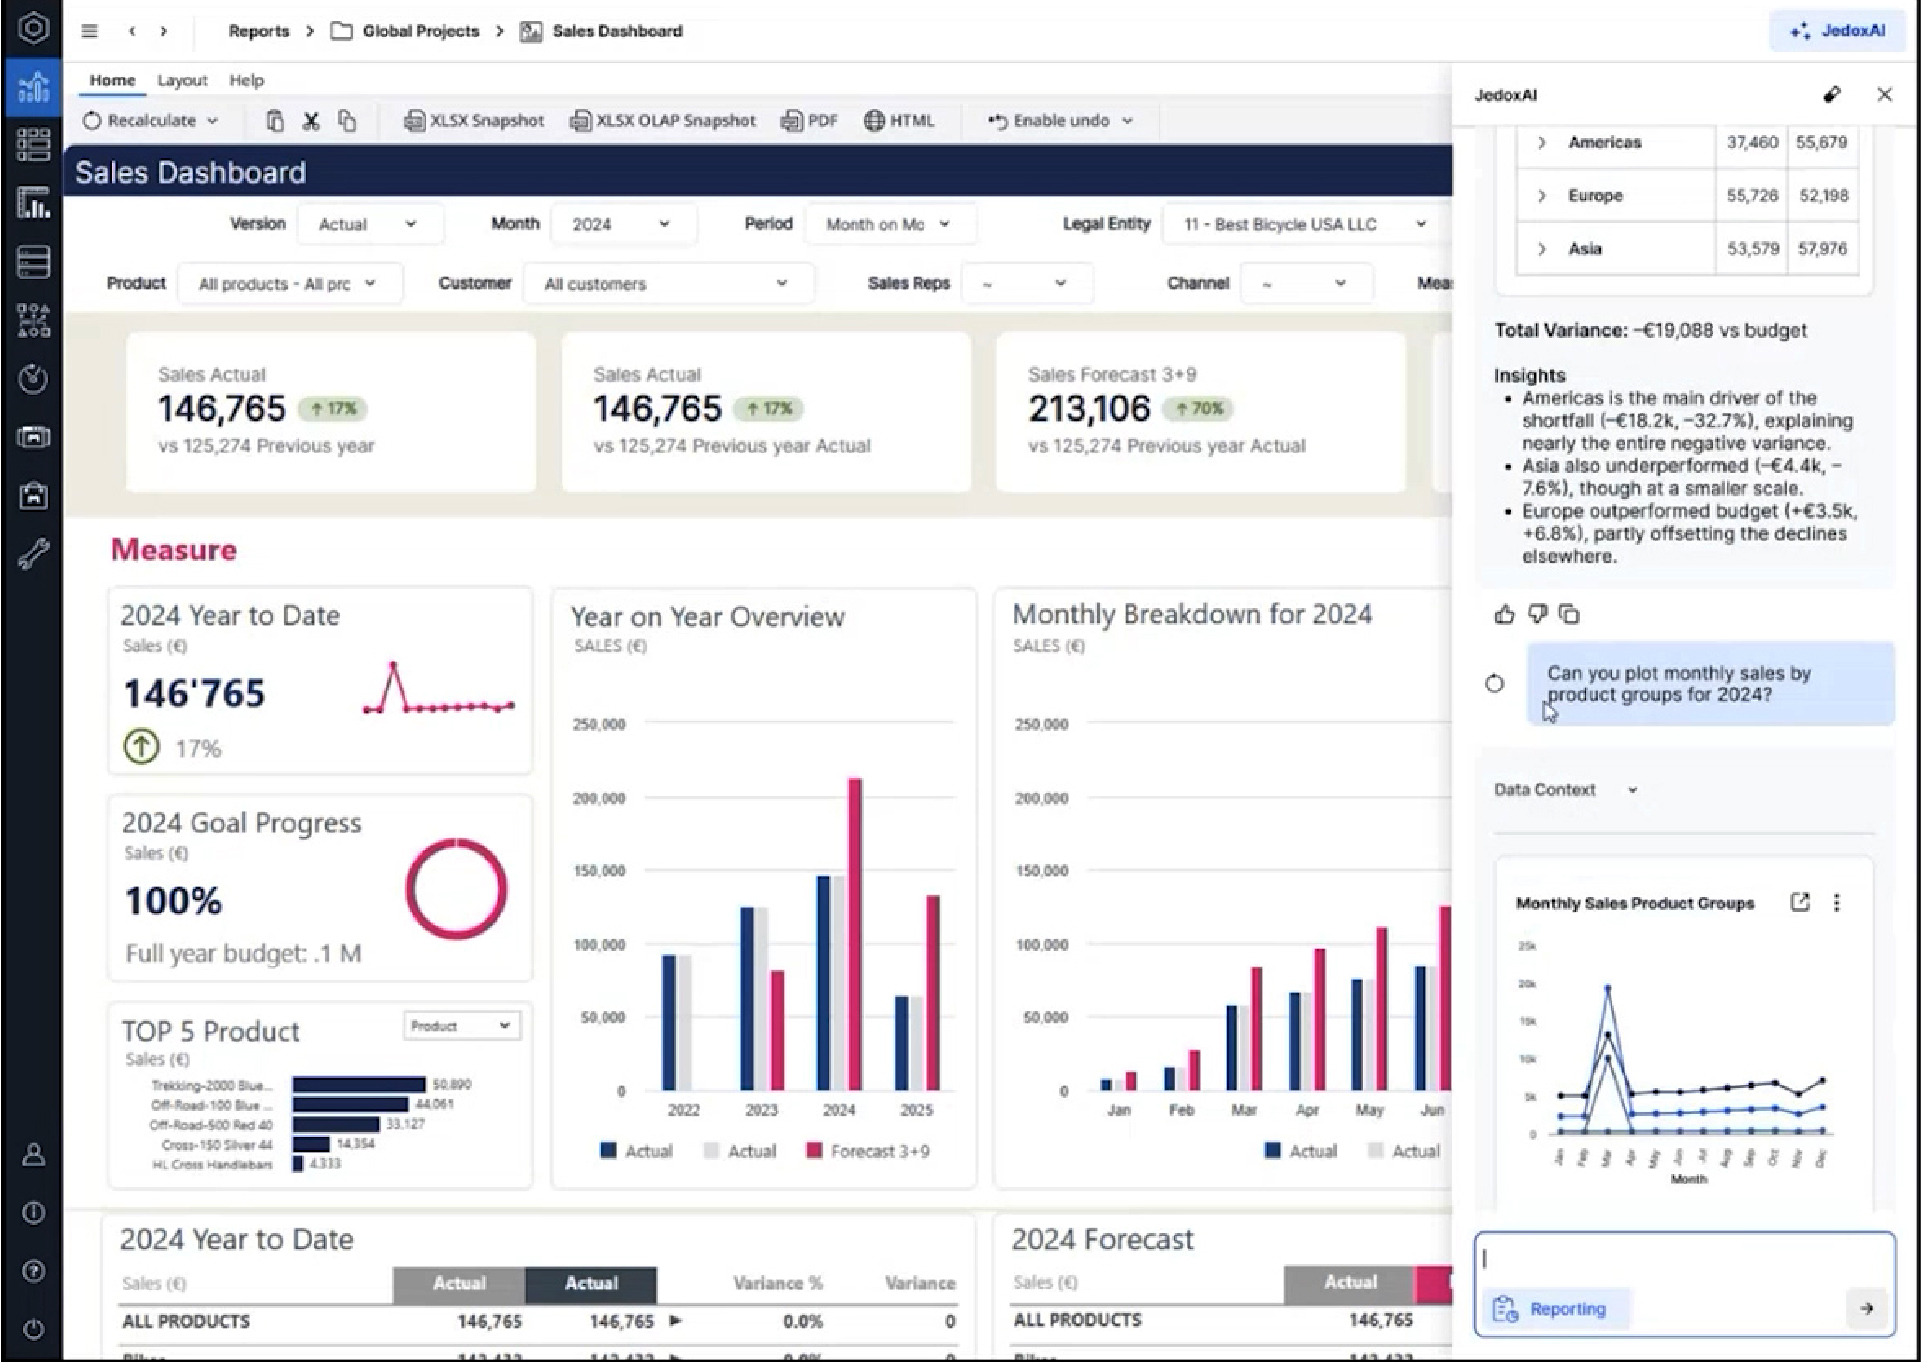
Jedox Sales dashboard with JedoxAI plot
Why board-ready reporting matters
Strong board reporting serves as the foundation for effective governance, strategic alignment, and stakeholder confidence.
When your board receives clear, reliable information, they can make faster decisions. Instead of spending meeting time clarifying numbers or questioning data accuracy, they can focus on strategic discussions about market opportunities, competitive positioning, and how to allocate resources.
Consider the alternative. Poor board communication creates confusion, erodes trust, and leads to micromanagement. When board members don’t understand the financial story or doubt the data quality, they ask more questions, request more detail, and lose confidence in management’s ability to execute.
The cost of this dynamic extends beyond frustrated meetings. Gartner research shows that poor data quality costs businesses an average of $12.9 million per year, as it has an immediate impact on revenue and leads to poor decision-making.
Core elements of effective board reporting
What separates exceptional board reports from those that are just “okay”? These foundational elements make a big difference:
1. Strong close process
Board-ready reporting starts with a tight financial close. If your month-end or quarter-end process drags on for weeks, you’re already behind. The best Finance teams treat the close as a sprint, with clear ownership, standardized workflows, and minimal manual intervention. A strong close means your board receives timely information while it’s still relevant for decision-making.
2. Alignment with strategy
Every metric in a board report should connect to a strategic objective. Revenue growth, margin expansion, customer acquisition costs, and cash conversion cycles aren’t just numbers. They’re indicators of strategic health. When you present KPIs, always tie them back to the company’s stated goals. If the board approved a growth strategy six months ago, your report should show progress against that plan.
3. Forward-looking insights
Boards care about history, but they care more about the future. Your report should dedicate significant space to forecasts, pipeline analysis, and scenario planning. What does the rest of the year look like? What assumptions underpin your projections? What could change the trajectory? Finance leaders who provide this forward-looking context position themselves as strategic partners, not just record-keepers.
4. Simplicity and visualization
Complex financial concepts need simple explanations, so don’t overcrowd your reports with unnecessary data points or huge chunks of text. One well-designed chart can convey what might take three paragraphs to explain. Follow the principle of one chart, one message to get your point across.
5. Readiness for scrutiny
Board members will ask questions. Auditors will review your work. Investors will probe assumptions. Your report needs to withstand this scrutiny. That means you need clear documentation, consistent methodologies, and transparent calculations. If you can’t explain how you arrived at a number, it shouldn’t be in the report.
Advantages of board reporting software
The traditional approach to board reporting involves countless hours of manual work: extracting data from multiple systems, copying and pasting into Excel, reformatting for consistency, and creating charts one by one. This process is not only time-consuming but also error-prone.
Modern board reporting software transforms this dynamic by delivering tangible benefits that directly impact the quality and efficiency of your reporting process:
Faster reporting cycles with less manual effort
Board reporting software enables Finance teams to build reports without waiting for IT to create custom queries or data extracts. Self-service analytics capabilities enable them to pull the data they need, format it appropriately, and generate visualizations on their own timeline. This independence accelerates the reporting cycle and eliminates the bottlenecks that traditionally stretched board pack preparation across weeks.
A recent study showed that the average employee spends over three hours per week searching for data, which adds up to a full month per year. They also waste another 30-60 minutes daily waiting for people to give them the information they need. Board reporting software reclaims this time by putting the right data at your fingertips.
Single source of truth across all data
Instead of manually consolidating information from your ERP, CRM, HR systems, and other platforms, board reporting software connects to these sources automatically and pulls data into a unified environment.
This integration ensures consistency, reduces reconciliation errors, and gives you confidence that every number in your board pack is based on the same underlying data set.
Professional presentation without design work
Pre-built templates, drag-and-drop chart builders, and interactive dashboards make it straightforward to create polished, professional-looking reports.
Plus, collaboration features allow multiple team members to contribute sections simultaneously, with version control ensuring everyone works from the same baseline. What once required design skills and hours of formatting now happens in minutes.
More strategic focus for Finance teams
When board reporting software handles data extraction, consolidation, and formatting automatically, Finance teams win back time for higher-value work: analyzing trends, developing strategic recommendations, and identifying opportunities the board should act on.
Instead of being record-keepers who report what happened last quarter, Finance leaders can position themselves as strategic advisors who help shape what happens next. The ability to spend more time on insights and less time on data wrangling transforms the Finance function from a passive reporter into an active driver of business performance.
“In the past, Finance was seen as a back-office function. Today, the expectations are changing very quickly. In Finance, we have a unique perspective on the business that allows us to become strategic partners.”
Christian Wattig, FP&A expert, Inside FP&A
Common challenges and how to fix them
Despite best intentions, many Finance teams struggle with recurring board reporting challenges:
Manual work and Excel dependence
Spreadsheets remain the default tool for many Finance professionals, but Excel isn’t a board tool and it was never designed for enterprise reporting. Version control issues, formula errors, and limited collaboration capabilities make Excel a liability.
To solve this, consider transitioning to a purpose-built reporting platform (like Jedox) that lets you keep the flexibility Finance teams love while adding built-in governance and automation.
“I love looking at my big Excel sheets, but we start to struggle if we want to analyze those numbers quickly and make them clear and actionable.”
Wolfgang von Loeper, Senior Consultant, Solution Advisory, Jedox
Inconsistent formats
When different team members create different sections of the board pack, formatting inconsistencies inevitably emerge. Font sizes vary, charts use different color schemes, and narrative styles clash. Establishing templates and style guides helps, but board reporting software is a better way to enforce consistency automatically.
Slow turnaround times
If your reporting cycle takes three weeks, you’re reporting on stale information. Boards need current data to make informed decisions. Streamlining the board pack creation process through automation, better data integration, and improved workflows cuts this timeline dramatically.
Siloed data
When Finance, Operations, Sales, and HR all keep their data in separate systems, pulling together a complete board report becomes a time-consuming hunt for information. You need both the right tools and the right approach to fix this problem.
Integrated reporting platforms connect your data sources automatically, while getting teams to align on shared metrics ensures everyone is working toward the same goals.
How AI is transforming board reporting
Board reporting is evolving rapidly. As companies invest heavily in AI infrastructure, data center operating costs (OPEX) are climbing fast, and boards need clear visibility into these expenditures and their return on investment (ROI). At the same time, the sheer volume and complexity of financial data is growing exponentially.
Modern FP&A software with integrated AI capabilities is helping Finance teams meet these challenges head-on. Here’s how:
1. AI tools help automate narratives
AI can now automatically draft explanations for changes in performance. It analyzes patterns and business drivers to explain why revenue missed the target or margins shrank. Finance teams can use these drafts as a starting point and then add their own context and strategic perspective.
2. AI enables real-time anomaly detection
These systems continuously monitor financial data and flag unusual transactions or unexpected variances as they happen. Instead of discovering problems weeks later during the close process, Finance teams can alert boards to new issues while there’s still time to respond.
3. AI improves forecasting accuracy
Machine learning algorithms consider more variables and identify patterns that traditional models might miss, giving boards more accurate projections and clearer confidence intervals for better strategic decisions.
The integration of AI-driven planning and reporting capabilities into modern FP&A platforms creates a seamless workflow from operational planning through board-level reporting. These systems keep your data consistent across different planning timeframes, maintain clear records of where numbers come from, and let boards review and question different scenarios in real time.
4. AI handles routine tasks
This technological shift is reshaping what CFOs and FP&A heads do day to day. They spend less time compiling manual data and more time interpreting strategy and building business partnerships.
AI frees Finance leaders to focus on judgment calls, risk assessment, and strategic guidance. It’s an exciting time, as the role evolves from data gatherer and report creator to strategic advisor.
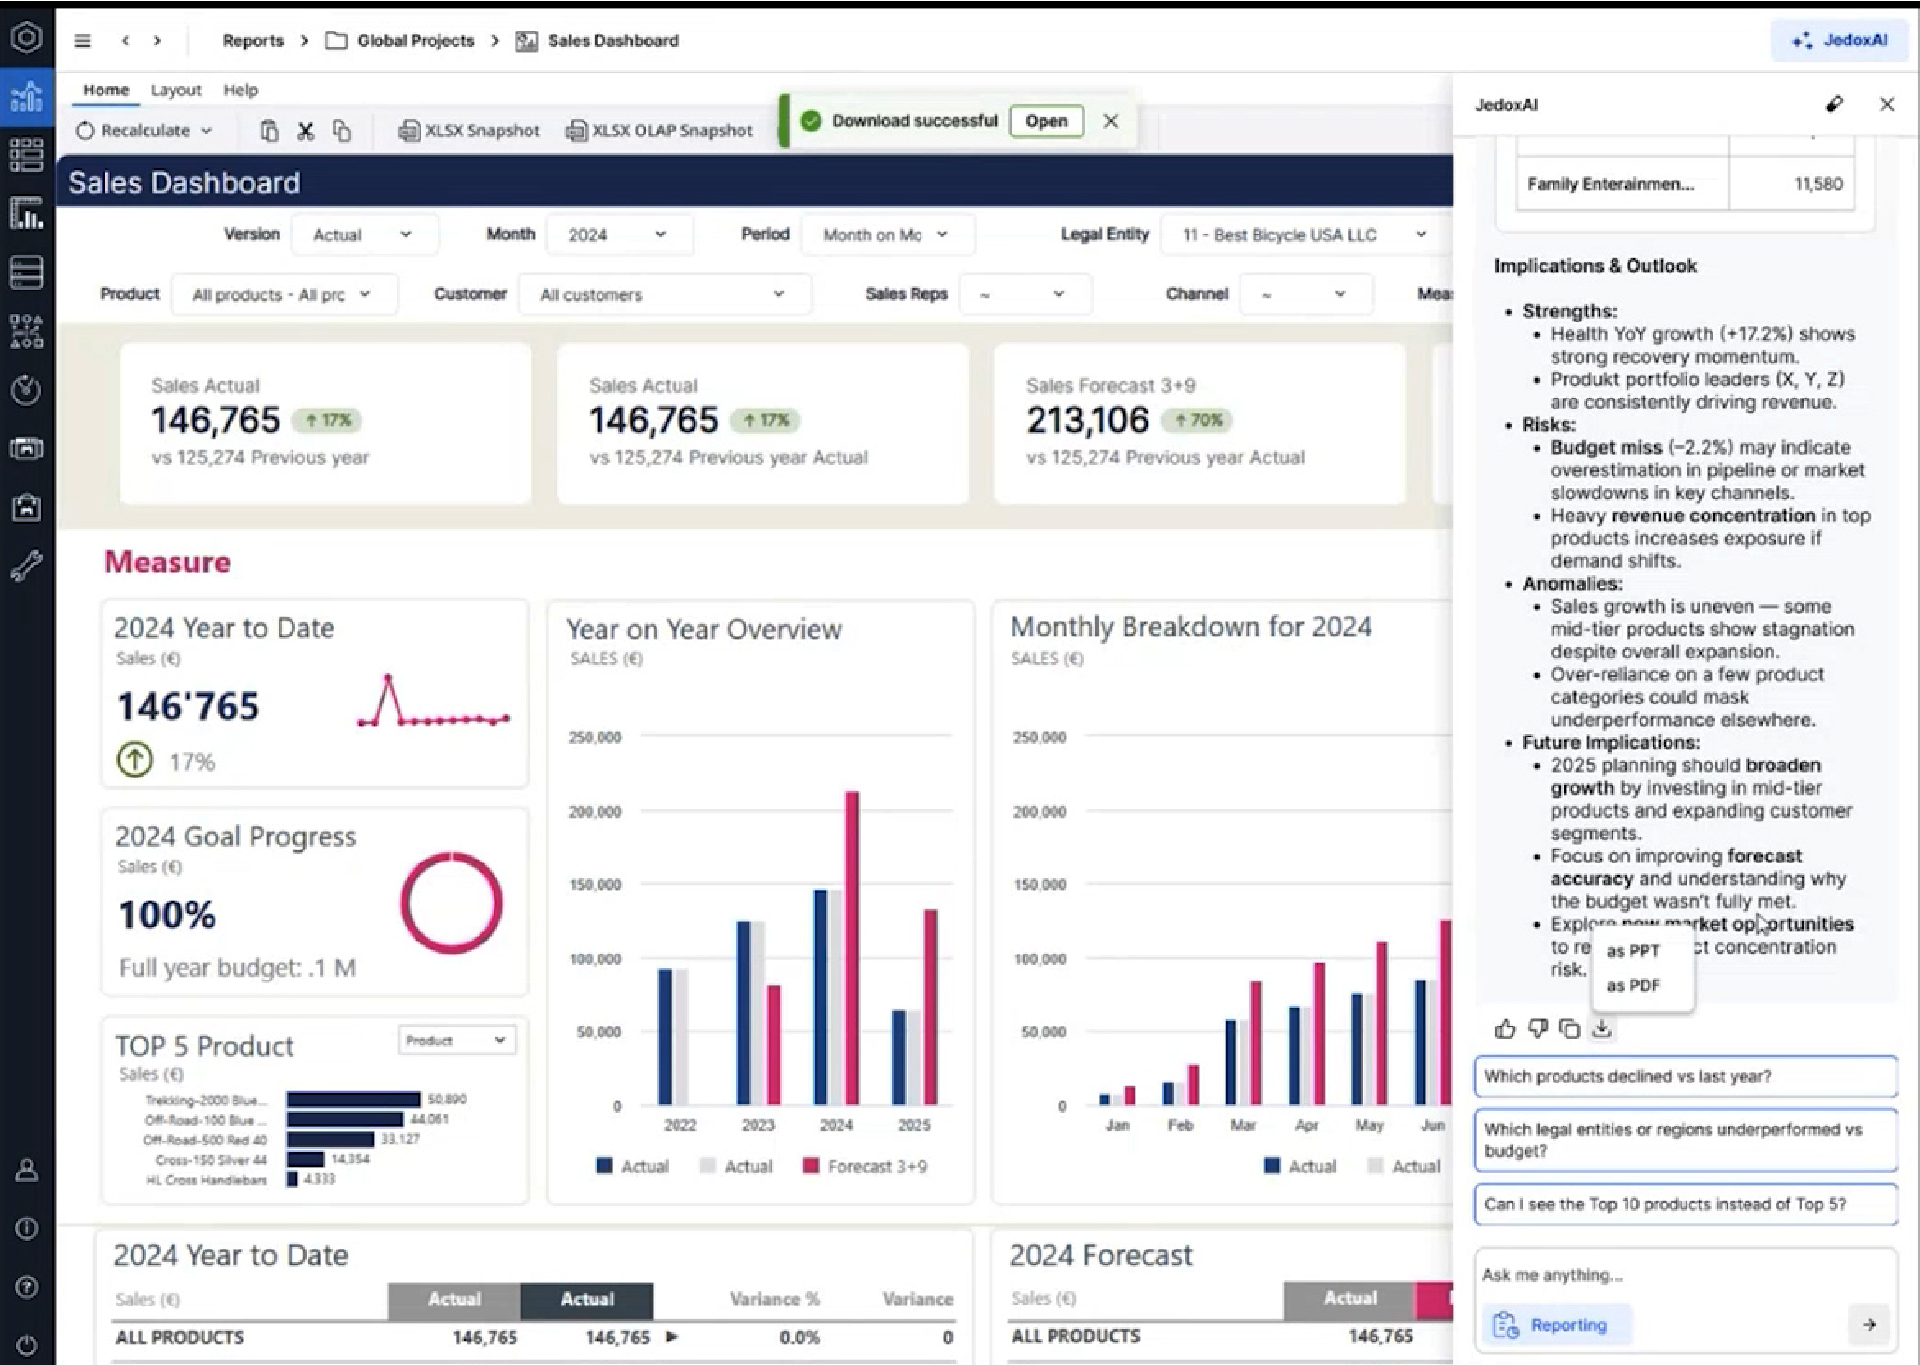
Jedox Sales dashboard with JedoxAI analysis
How to create a board-ready report: A step-by-step guide
Creating an effective board-ready report takes planning and a clear process. Here’s how to do it:
Step 1: Define the purpose and audience
Before creating any content, clarify what the board needs to know and decide. Are they evaluating a major investment? Assessing risk exposure? Reviewing annual performance? Understanding the meeting’s purpose shapes every subsequent decision.
Step 2: Identify strategic KPIs
Select metrics that directly relate to board-level strategic questions. Avoid the temptation to include every available data point. Focus on the vital few metrics that truly matter. These typically include revenue growth, profitability margins, cash flow, customer metrics, and operational efficiency indicators relevant to your industry.
Step 3: Execute a clean data close
Ensure all financial systems are closed and reconciled. Verify data quality across source systems. This step is non-negotiable: “garbage in, garbage out” applies especially to board reporting. If your data isn’t trustworthy, nothing else matters.
Step 4: Build the narrative structure
Start with an executive summary that answers the board’s most likely questions. Then structure subsequent sections logically: current performance, variance explanations, forward outlook, risks and opportunities, and recommendations. Each section should flow naturally to the next.
Step 5: Create visualizations
Translate key data points into clear, simple charts. Use line graphs for trends, bar charts for comparisons, and tables only when precise numbers matter. Remember: one chart, one message. If a visual requires extensive explanation, it’s too complex.
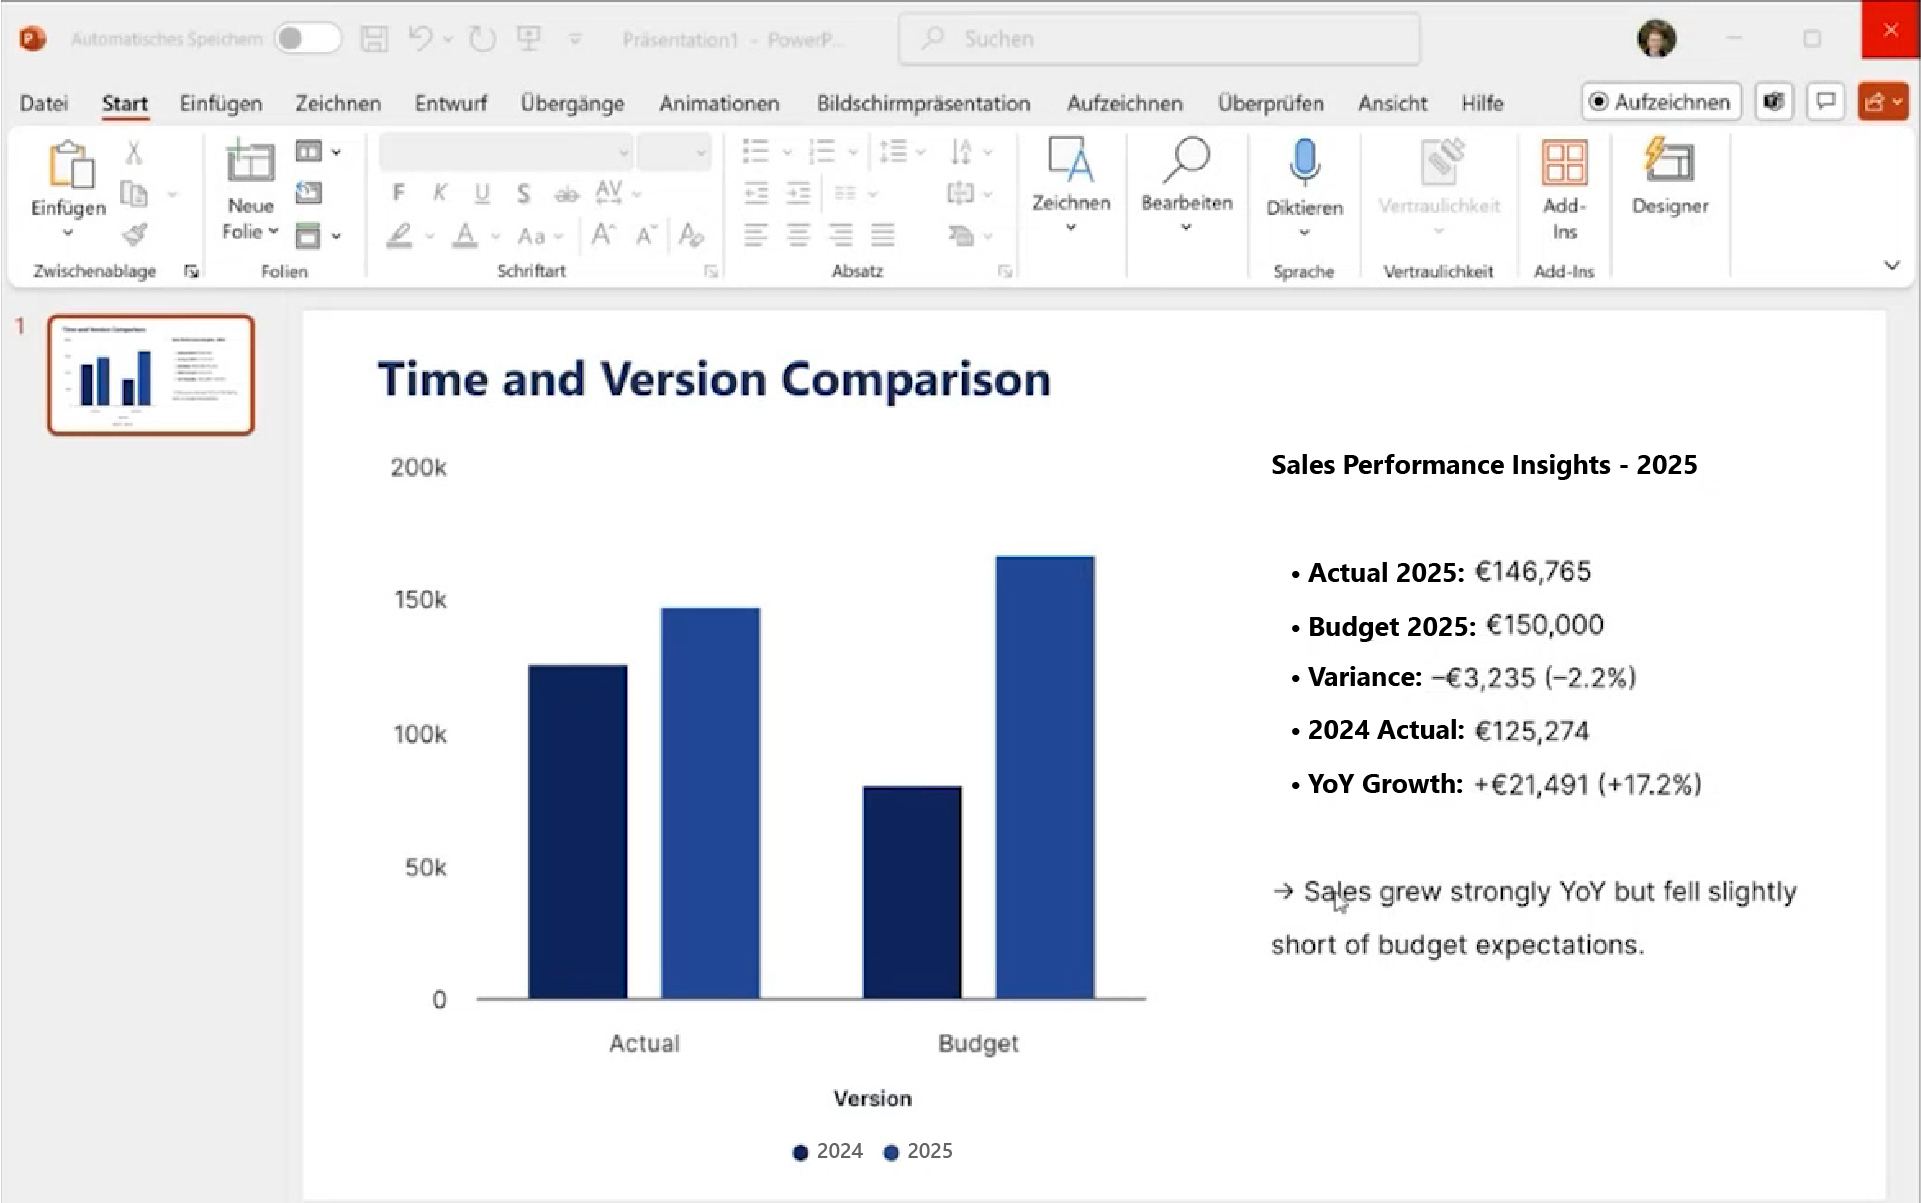
An example of a chart created via Jedox
Step 6: Draft commentary
Explain the “why” behind the numbers. Boards don’t just want to know that revenue missed the forecast by 5%. They want to understand what drove the miss, whether it’s a temporary blip or a troubling trend, and what management is doing about it. Context transforms data into insight.
Step 7: Review and refine
Before finalizing, review the report from the board’s perspective. Is anything confusing? Are assumptions clearly stated? Does the narrative hold together? Have others on the Finance team review it as well. Fresh eyes catch issues you might miss.
Step 8: Prepare backup materials
Anticipate follow-up questions and prepare supporting schedules, detailed variance analyses, and additional context. You may not need to present this material, but having it ready demonstrates preparedness and builds confidence.
Best practices for board-ready reporting
Once you have the structure and process in place, these practices will help you create reports that boards find useful:
- Be concise: Getting to the point shows respect for the board’s time and demonstrates clear thinking, while dense, lengthy reports are hard to follow. If you can say something in one page instead of three, do it.
- Lead with insights, not data: Start each section with the conclusion or key takeaway, then provide supporting evidence. Boards are busy. They need the headline first, with details available for those who want to dig deeper.
- Always explain the “why”: Numbers without context are just numbers. When revenue grows 15%, explain what drove that growth. When margins compress, explain the underlying factors. The board’s job is strategic decision-making, and they can’t make good decisions without understanding causality.
- Be visual: Use charts and graphs liberally. Visual information is processed faster and more memorably than text or tables. Well-designed visuals also make your reports more engaging and professional.
- Focus forward: While historical performance matters, boards are more interested in what comes next. Dedicate substantial space to forecasts, trends, and strategic outlook. Show multiple scenarios when appropriate, highlighting key assumptions and potential inflection points.
- Maintain consistency: Use the same KPIs, formats, and structures across reporting periods. Consistency enables boards to track trends and make valid comparisons. When you need to change something, explain why.
- Provide accountability: Clearly indicate who owns each initiative or metric. Accountability drives execution, and boards need to know who’s responsible for what.
- Test for clarity: Before finalizing, ask someone unfamiliar with the details to read your report. If they can understand the key messages without additional context, you’ve achieved clarity.
What’s next for your board reporting?
Board-ready reporting means delivering concise, decision-ready financial insights that boards can trust and act on immediately. But delivering this level of quality is getting harder. Governance expectations are rising, data environments are more complex, and boards want faster turnaround with deeper analysis.
AI-powered platforms are the answer. The shift from manual, Excel-based processes to AI-driven tools is transforming what’s possible. Automated summaries, real-time anomaly detection, and accurate forecasting give Finance teams the tools to deliver better insights in less time, while reducing errors and building stakeholder confidence.
The next evolution of board reporting will be conversational and predictive, with board members asking natural language questions and receiving instant, data-backed answers.
Ready to transform your board reporting process? Explore how AI-driven planning and reporting can help you deliver the insights your board needs with a fraction of the effort.
What's the difference between board-ready reporting and management reporting?
Board-ready reporting focuses on strategic objectives. Board reports are more concise, forward-looking, and high-level. Management reporting, on the other hand, addresses operational details and departmental performance. It provides the granular detail that department heads and executives need to run day-to-day operations.
Which KPIs should a board report include?
The right KPIs depend on your company's strategy and industry, but most board reports include metrics related to growth, profitability, and cash. Revenue growth rates, gross and operating margins, EBITDA, cash flow from operations, and working capital metrics typically appear in every board report. The key is ensuring every KPI connects to a board-level strategic objective.
How often should board-ready reports be prepared?
Most organizations prepare formal board reports on a quarterly basis, aligned with board meeting schedules. However, many also produce monthly financial snapshots or board pack updates between formal meetings, particularly in fast-moving environments or during periods of change. The frequency should match the board's information needs and the organization's reporting capabilities.
What makes a report "board-ready"?
A truly board-ready report demonstrates four essential characteristics: accuracy (data is correct and audit-proof), consistency (same methodologies across periods), forward-looking insight (forecasts and strategic context), and visual clarity (easy for busy board members to understand quickly). A board-ready report also anticipates questions, provides context for variances, and connects financial performance to strategic objectives.
How is AI changing board reporting in 2025?
AI is automating many of the time-consuming tasks that previously consumed Finance teams' time. It can explain in plain language why performance changed, spot patterns in historical data, and model multiple scenarios at scale. This all allows boards to evaluate strategic options quickly and make better decisions. While human judgment and oversight remain essential, AI handles routine analysis and report writing, freeing Finance leaders to focus on strategic objectives.