11 financial KPIs to keep your business on track
Determining the right financial key performance indicators (KPIs) for your business is essential, as they provide valuable insights for financial planning and analysis (FP&A) activities. KPIs help you measure performance, identify trends, and make choices that align with your strategic goals. The metrics you prioritize will depend on your industry, business model, and specific objectives.
Some KPIs, like gross margin or cash flow, are universal, while others are industry-specific. For example, manufacturers must monitor the status of their inventory, while SaaS and subscription-based businesses focus on annual recurring revenue. In this article, we provide formulas, examples, and guidance to help you select the right financial KPIs for effective corporate financial planning.
Finance KPIs are metrics organizations use to track, measure, and analyze the financial health of the company. They can be divided into several categories: Profitability, Liquidity, Efficiency, Leverage, Cash flow and Growth.
How to set KPIs for a Finance department?
- Align KPIs with business goals: Ensure they reflect priorities like profitability (e.g., gross margin, operating income).
- Ensure your KPIs are balanced, covering revenue, costs, cash flow, and profitability without overemphasizing one area. Avoid metrics that look good but don’t drive meaningful business outcomes.
- Define details for each KPI:
✓ Assign owner
✓ Define calculations
✓ Set specific goals and acceptable ranges
✓ Identify where data comes from (e.g., accounting software, ERP system, etc.)
✓ Schedule reviews (e.g., weekly, monthly) - We strongly recommend using a KPI dashboard for centralized tracking.
Profitability KPIs
Profitability KPIs measure a company’s ability to generate profit relative to revenue, assets, or equity.
Gross profit margin
The gross profit margin reveals how much money a company has left after paying for the goods it sells. This shows how profitable the company’s main business operations are.
- Gross profit: This is your total sales revenue minus the direct costs of making those goods (or “cost of goods sold”). You can find both figures on your company’s income statement.
- Net sales: Your total revenue after taking out any customer returns, discounts, or special offers.
A high gross profit margin means your company earns strong profit from its sales. This can be due to high prices, low production costs, or selling a lot of goods. If it’s low, the company isn’t earning as much as it should from its sales.
What’s a good profit margin?
NYU Stern shared data on industry margins in January 2025 on average gross profit margins:
- Education companies: Average gross margin of 41.15%
- Machinery companies: 37.08%
- Real estate developers: 35.13%
- Oilfield services: 10.71%
- Grocery stores: 26.09%
- Software: Among the highest margins (e.g., Internet: 60.82%, Entertainment: 65.38%, Systems & application: 72.38%)
Operating margin
Operating margin (also called return on sales or ROS) shows how much profit a company extracts from each dollar of revenue before accounting for taxes, interest, or one-time events.
Operating Margin = ( Operating Income / Revenue ) × 100
- Operating income: This is your revenue minus the costs to run your business. These costs include salaries, office rent, and marketing. It does not include taxes, interest payments, or unusual gains or losses.
- Revenue: The total amount of money your company made from selling its goods or services.
Example:
Let’s suppose your company earned $750,000 in revenue last year, and the operating costs were $450,000.
Your operating income is $750,000 – $450,000 = $300,000.
Operating margin = ($300,000 ÷ $750,000) × 100 = 40%
This means that for every dollar of revenue, your company retained 40 cents in profit after operating costs.
What’s a good profit margin?
Simply put, higher margins are better. But keep in mind that operating margins vary by industry. For instance, consultants or accountants with low overheads typically have higher margins than product-based businesses with high production costs.
EBITDA
EBITDA is an acronym that stands for Earnings Before Interest, Taxes, Depreciation, and Amortization. EBITDA simplifies a company’s performance by showing how its main activities are doing, ignoring outside expenses like interest or taxes.
There are two EBITDA formulas:
EBITDA = Net income + Taxes + Interest expenses + Depreciation + Amortisation
or
EBITDA = Operating income + Depreciation & Amortisation
- Interest expenses: This is the money spent on debt. In EBITDA calculations, interest payments are re-added to your earnings.
- Taxes: The amount of tax can fluctuate, often for reasons outside a company’s operational performance. The earnings (net income), tax, and interest data appear on the income statement.
- Depreciation & amortization: These reflect the natural decline in asset value over time. They typically show in the notes to operating profit or on the cash flow statement.
What’s a good EBITDA?
A strong EBITDA is considered to be at least two times the company’s interest expense. For example, if a company’s annual interest expense is $1 million, then a strong EBITDA would be at least $2 million.
In some industries, a higher EBITDA margin above 15% or more may be considered favorable. A good EBITDA varies by industry, company size, industry norms, growth stage, and capital structure.
EBITDA is often used for asset-heavy industries with substantial property, plant, equipment, and high non-cash depreciation costs. However, it can be deceptive for such businesses because it doesn’t account for significant ongoing capital expenditure (CAPEX). For instance, manufacturing requires regular machinery investments, which EBITDA doesn’t show.
Liquidity KPIs
Liquidity KPIs assess a company’s ability to meet short-term financial obligations.
Cash ratio
The cash ratio indicates whether a company can handle its short-term obligations using only cash and cash equivalents. This is a strict liquidity measure, as it only considers cash that’s immediately available without converting assets.
Simply put, a company looks at the cash ratio to check if it has enough cash to settle its immediate debts.
- Cash and cash equivalents: Funds held as cash or easily converted to cash.
- Current liabilities: Obligations due within one year; includes accounts payable and other short-term debts.
What’s a good cash ratio?
There’s no universal “good” cash ratio. Many companies aim for around 1.0, meaning enough cash for short-term debts, but this is rare. Most companies avoid such high ratios due to lost investment opportunities. Ratios between 0.5 and 1.0 are good, showing a company can largely cover its obligations with cash.
Ratios below 0.5 may signal liquidity problems, while those above 1.5 might mean too much idle cash.
Efficiency KPIs
Efficiency KPIs evaluate how effectively a company uses its resources to generate revenue.
DSO
Days sales outstanding (DSO) measures how long a company takes to collect payments after a sale. Quick payment collection supports a company’s financial health, enabling it to meet obligations, invest, and operate smoothly.
A low DSO means cash comes in fast, helping cover expenses. A high DSO means longer waits for payments. Persistent high DSO can point to issues with customer credit, invoicing, or credit policies.
DSO = (Total accounts receivable × Number of days in the period) / Total credit sales
- Period: The chosen timeframe (month, quarter, year)
- Accounts receivable (AR): Money owed by customers at period end
- Total credit sales: Sales made on credit during the period
Example:
Accounts receivable (AR): $90,000
Total credit sales: $450,000
Period: 365 days
Divide accounts receivable by credit sales: $90,000 / $450,000 = 0.20
Multiply by the number of days: 0.20 x 365 = 73 days
The resulting number is the average number of days it takes for your business to collect payment after a sale. In our example, it means on average, it takes your customers 73 days to pay their invoices.
What’s a good DSO?
A lower DSO is generally better, with most businesses aiming for under 45 days. However, what qualifies as a “good” DSO depends on the industry. For instance, a DSO of 85 may be typical for industrial manufacturers selling costly equipment, but it would be a concern for clothing retailers expecting quick payments. Seasonal or cyclical businesses may also see natural DSO changes based on sales timing.
Cash flow KPIs
This category is about tracking the inflow and outflow of cash.
Operating cash flow
Operating cash flow (OCF) shows the cash a company makes from its main business activities (selling products or services). It’s the first part of a cash flow statement.
- Net income: This is the company’s after-tax profit from the income statement.
- Non-cash expenses: Expenses such as depreciation and amortization are added back to net income in the OCF calculation. This is because they appear on the income statement but do not involve actual cash outflow.
- Changes in working capital: This includes all current assets (excluding cash) minus all current liabilities (excluding debt). An increase in current assets reduces cash, while an increase in current liabilities increases cash.
- When accounts receivable decrease (customers pay sooner), OCF rises.
- When inventory increases (more cash is tied up in goods), OCF decreases.
- When accounts payable increase (payments to suppliers are delayed), OCF increases.
What’s a good OCF?
Companies with strong or improving OCF are generally seen as financially healthy. The OCF is commonly used to calculate the OCF ratio:
Example: If OCF is $200,000 and current liabilities are $100,000, the OCF ratio is 2.0. This means the company generates $2.0 from operations for every dollar of current liabilities, or can cover its current liabilities 2 times over.
- A ratio below 1 means the company doesn’t generate enough cash from operations to cover short-term debts, indicating potential financial strain.
- A ratio above 1 is preferred by investors, as it shows the company can meet its short-term obligations and still have cash left.
SaaS KPIs
These metrics measure the performance, growth, and health of SaaS businesses.
Revenue growth
Revenue growth measures how much a company’s revenue changes over time, often yearly or quarterly. It shows how well a business is doing by indicating sales changes and expansion.
For example, if you made $3 million in revenue last year and $4.5 million this year, your growth is 50%. This can be calculated annually, quarterly, monthly, etc.
You can calculate revenue growth using this simple formula, but that’s just the first step. You also need to see how it connects to other accounting metrics. For subscription businesses, recurring revenue is key, so factoring in churn is essential to fully understand revenue growth.
What’s a good revenue growth?
To answer this question, you need to refer to your specific industry. However, established companies often aim for 10-20% annual growth. Newer companies or those in fast-growing sectors might aim for higher rates.
CAGR
CAGR, or compounded annual growth rate, is a reliable way to measure and compare returns for investments that change in value over time. Investors use it to see how one stock performs compared to others or a market index.
However, CAGR isn’t the actual return rate—it shows how an investment would grow if it increased at a steady rate each year with profits reinvested annually.
EV = Ending value
BV = Beginning value
n = number of years
Example: Imagine you invested $20,000 in a portfolio.
- From Jan. 1, 2020, to Jan. 1, 2021, your portfolio grew to $25,000 (or 25% in year one)
- On Jan. 1, 2022, the portfolio was $27,500 (or 10% from January 2021 to January 2022)
- On Jan. 1, 2023, the portfolio ended with $34,925 (or 27% from January 2022 to January 2023)
The year-by-year growth rates were different, but CAGR smooths out the performance. Over this three-year period, the CAGR was 21.31%. Here’s how it’s calculated:
CAGR = ((34925/20000)^1/3 – 1) x 100 = 21.31%
The CAGR of 21.31% over the three-year investment period can help an investor compare alternatives for their capital or make forecasts of future values.
Many investors prefer the CAGR because it smooths out the volatile nature of year-by-year growth rates. For instance, even a highly profitable and successful company will likely have several years of poor performance during its life.
What’s a good CAGR?
For business growth, CAGR benchmarks shift dramatically based on company stage and industry.
- Startups/High-growth companies: Early stages often see 20%–50% CAGR, especially in tech or SaaS.
- Mid-sized businesses: 15%–25% CAGR shows healthy growth.
- Mature companies: 5%–10% CAGR is strong for large, stable firms, especially dividend-paying ones.
ARR/MRR
Annual recurring revenue (ARR) is the predictable and consistent revenue a company expects to receive from its products or services over one year. Companies with annual subscriptions use ARR to forecast their yearly revenue.
ARR is common in SaaS businesses. It’s also useful for streaming services, phone plans, and other products or services with steady, predictable fees.
For example, a SaaS company has annual subscriptions of $8 million. The company earns an additional $500,000 in maintenance fees. It loses about 3% of customers each year, or $240,000.
ARR = $8,000,000 + $500,000 – $240,000 = $8,260,000
ARR is calculated yearly, while MRR gives a detailed view of changes month by month. For instance, if you adjust your pricing in April, you can see the impact in May. It also helps track revenue shifts caused by factors like seasonal trends or economic changes.
CAC
Customer acquisition cost (CAC) is the money a business spends to get a customer to buy its products or services. CAC is key to measuring customer profitability and sales efficiency.
Want to understand CAC and more? Our article about sales KPIs has the answers you need.
LTV (CLTV, CLV)
Customer lifetime value (LTV, CLTV, or CLV) is the total money you expect to receive from a customer over their entire relationship with your company. It measures a customer’s overall contribution to your business during a specific period.
There are numerous ways to calculate the CLV. Here is a simple formula:
CLV is vital for growing SaaS companies because:
- A high CLV indicates strong product/market fit and customer loyalty, reflecting how well your offering connects with customers.
- Your cost to get a customer might be more than their first purchase. But that same customer could bring in more money later. CLV helps answer this key question.
Define finance KPIs once, reuse them everywhere
After carefully selecting your key performance indicators, the next crucial step is efficient KPI management.
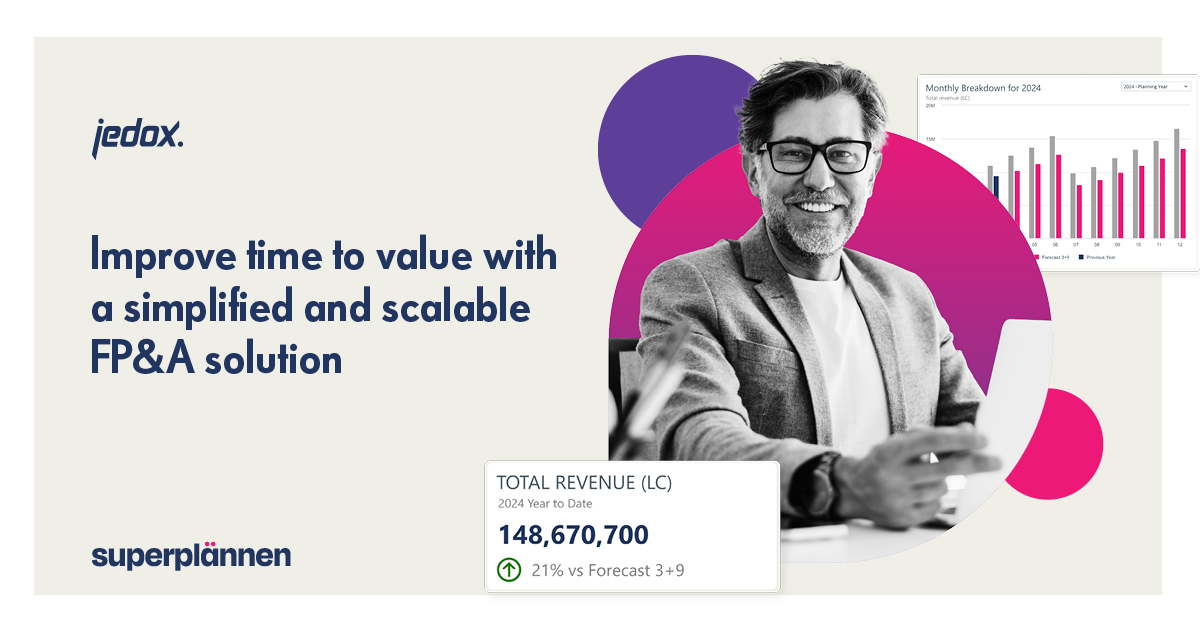
In Excel, key figures often require repeated adjustments. However, platforms like Jedox allow you to define them once and reuse them across your models. In fact, the KPI calculation can be different depending on whether you’re using actual or planning data. This is thanks to Jedox’s multidimensional calculation methods, which make it easier for users to define their KPIs.
Ready to see how Jedox can revolutionize your financial KPI management? Schedule a demo today.
What is a KPI in Finance?
Key performance indicators (KPIs) in Finance are measurable metrics used to assess a company's financial health and performance against specific goals, such as profitability, liquidity, and efficiency.
How to set financial KPIs?
To define the right financial KPIs, align them with your organization's strategic goals and key performance drivers, such as revenue growth or cost efficiency. Choose SMART (specific, measurable, achievable, relevant, time-bound) metrics and set realistic targets based on historical data, industry benchmarks, or strategic objectives. Regularly monitor performance, analyze progress, and adjust KPIs as business needs evolve.
What are the most important financial KPIs?
Common financial KPIs include gross profit margin, net profit margin, operating cash flow, current ratio, quick ratio, debt-to-equity ratio, current accounts receivable, and current accounts payable.
What is the difference between financial and operational KPI?
Operational KPIs focus on day-to-day processes, productivity, and customer-related metrics like retention rates or on-time delivery. Financial KPIs measure profitability and risk through indicators such as revenue growth, EBITDA, and net profit margin.
How to calculate net profit margin?
Net profit margin is calculated by dividing net income by total revenue and multiplying the result by 100. This metric shows the percentage of revenue that remains as profit after all expenses, taxes, and costs are deducted.